
Crude Oil in China
Markets are trending downwards;
China supports crude prices;
Gold formed support at $1,840.
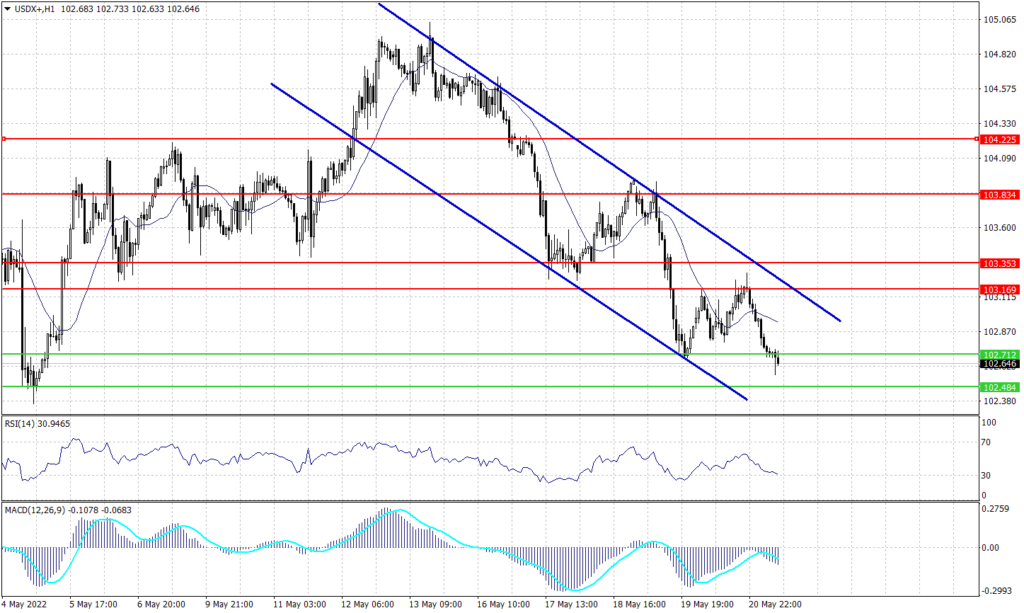
The dollar index remains in a downtrend channel reaching the support between 102.60 and 102.50. Additionally, the index is trading below the 20 day moving average on the daily chart indicating a possibility for a further decline. Furthermore, the index closed below the previous uptrend channel on the daily chart for four days.
Likewise, the index forms a declining pattern on the hourly chart which targets 102.50 unless it closed above the 20 hours moving average. Technical indicators are not providing clear signals which indicate the need to hold until there is a clear direction.
| SUPPORT | RESISTANCE |
| 102.35 | 103.10 |
| 102.00 | 103.35 |
| 101.60 | 104.10 |
The Eurozone currency hit resistance at 1.0610 as shown in the hourly chart, while it remains in the declining channel in the long run. Additionally, the pair formed light support above 1.0540 on the hourly chart signals a possibility for a further advance. However, the advance is not confirmed unless the pair penetrated above the resistance of 1.0610.
The regression channel following the chart shows a fair momentum upwards in the hourly chart. However, Fibonacci retracement shows a solid resistance below 1.0610 and the possibility of a retreat towards 1.0560. Technical indicators show a higher possibility to fall than continuing the uptrend, however, the moving average on the daily chart remains above the current price levels.
| SUPPORT | RESISTANCE |
| 1.0550 | 1.0610 |
| 1.0510 | 1.0650 |
| 1.0470 | 1.0675 |
The Cable remains under pressure below the resistance level of 1.2550 on both the daily and hourly charts. However, the sterling pound remains inside the declining channel on the daily time frame.
The price chart is touching the upper band of Bollinger Bands indicators, which signals a higher possibility to retreat towards 1.2560 on the hourly chart and 1.2460 on the daily chart.
Meanwhile, the pair shows a possibility to move on the hourly time frame between 1.2440 and 1.2500. The RSI and MACD are showing signals for a further decline, while price action retains the reading of 1.2100 on the daily time frame.
| SUPPORT | RESISTANCE |
| 1.2500 | 1.2622 |
| 1.2440 | 1.2695 |
| 1.2350 | 1.2750 |
The Japanese Yen retains its momentum against the greenback and cements its trend after touching its best rate in a month at 127.00. The USDJPY pair traded below the support of 128.70 today and building resistance at 128.00.
Meanwhile, after breaking below 128.70 the pair is confirming the downtrend on the hourly chart and signaling a higher possibility of the continuation on the daily chart. While the moving average reading indicates that the current level is critical resistance, MACD and RSI readings remain neutral.
| SUPPORT | RESISTANCE |
| 127.80 | 128.70 |
| 127.00 | 129.10 |
| 126.60 | 129.45 |
The yellow metal trades higher for the fourth day touching 1,855 during the early trades and heading higher. Gold cemented the corrective pattern on the daily chart and penetrated the long-term declining channel with three days closing. However, the hourly chart shows support above 1,840 formed during Friday’s trades.
However, the chart remains negative on the daily time frame while solidifying the support at 1,810. Meanwhile, the RSI indicates that the metal is overbought while MACD is close to the intersection point.
| SUPPORT | RESISTANCE |
| 1,810 | 1,875 |
| 1,800 | 1,895 |
| 1,792 | 1,905 |
West Texas crude is showing an uptrend on the hourly chart amid the Chinese decision to increase the strategic reserves. Meanwhile, on the hourly chart, the crude shows support at $107.10 and resistance below $111.30.
Despite the heavy buying momentum, technical indicators show a possibility to see crude oil lower at $107. However, Fibonacci retracement and 20 periods moving average show a higher probability of continuing climbing.
| SUPPORT | RESISTANCE |
| 107.10 | 111.30 |
| 105.75 | 112.75 |
| 104.30 | 115.00 |
Prices of gold continue to rise with the growing fear of a global recession. Investors…
U.S. stock futures declined ahead of retail sales data Dow Jones Industrial Average futures fell…
Dear Valued Client, Please be advised that the following CFD instruments will be automatically rolled…
Dear Valued Clients, Please be advised that the following instruments' trading hours and market session…
EURUSD Nears Major 1.1500 level EURUSD nears the crucial level of 1.1500 as pressure on…
Tech stocks drive US indices higher Monday's session closed higher, led by tech stocks after…
This website uses cookies.