
US dollar symbol, dollar coins, and inflation rate. Investors awaiting for CPI data.
The U.S. dollar index steadied on Wednesday as traders are waiting for a key U.S. report on inflation to provide hints to the Federal Reserve’s plans for future monetary tightening.
The Consumer Price Index (CPI) report will be released later today, with markets watching for signs that inflation eased in July despite last week’s unexpectedly strong U.S. jobs numbers.
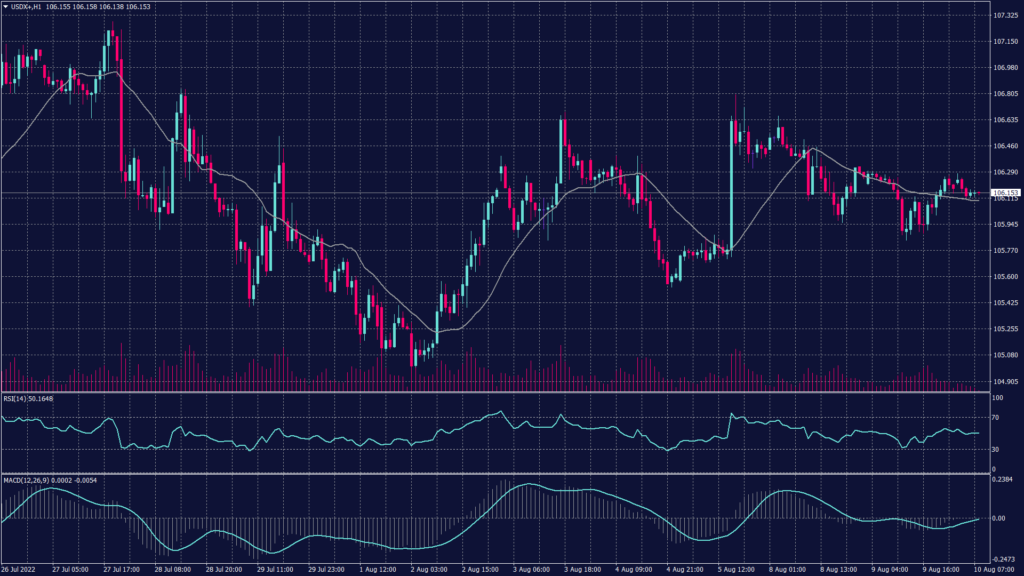
The U.S. dollar index remains to hold above 106.00 and moves above the support range between 105.90 and 106.00 while keeping the uptrend on the daily chart. The index is not seen changing the trend direction unless it traded below 103.80 which is technically far target.
Technical indicators show a possibility for fluctuation and a chance to trade below 105.90 for a short while.
| SUPPORT | RESISTANCE |
| 106.00 | 106.50 |
| 105.60 | 106.80 |
| 104.30 | 107.22 |
The Cable is possible to fall to the lowest level since the pandemic as the Federal Reserve’s rate-hike path continues to outpace that of the Bank of England’s. Meanwhile, the BOE’s recent recession warning combined with growing expectations of another 75 basis-point interest-rate hike in the U.S.
Sterling has fallen 10% year-to-date against the dollar, ranking in the bottom three among G-10 peers as the Federal Reserve’s rate-hike path has outpaced that of the BOE.
The cable is trading at the support level above 1.2070 and signals a possibility of breaking below it after developing 3 short candles on the daily chart. Meanwhile, the hourly chart is confirming the reading of the daily chart.
Moving average is closing towards the current levels and signaling further drop on the hourly chart below 1.2000.
| SUPPORT | RESISTANCE |
| 1.02050 | 1.02480 |
| 1.01900 | 1.02800 |
| 1.01500 | 1.02900 |
Gold prices were steady on Wednesday as safe-haven demand rose ahead of key U.S. inflation data. as spot gold prices hovered around $1,793.99 an ounce, while gold futures fell 0.1% to $1,809.95.
Buying into the yellow metal has been supported this week by anticipation of U.S. CPI inflation data, due later today. While the reading is expected to have declined slightly from last month to an annual 8.7% rate in July, inflation is still expected to remain pinned at 40-year highs.
This, coupled with a stellar payroll report for July, could open the door to a bigger-than-expected interest rate hike by the Federal Reserve next month.
The precious metal remains committed to the daily chart’s downtrend and will remain so unless it broke above the channel at 1,800. Meanwhile, the hourly chart shows slight support above 1,780 but remains to indicate a downward movement towards 1,770.
Technical indicators signal an intense fluctuation between 1,770 and 1,788 but both RSI and MACD support the theory of going back below 1,770.
PIVOT POINT: 1,790
| SUPPORT | RESISTANCE |
| 1,770 | 1,800 |
| 1,767 | 1,810 |
| 1,759 | 1,825 |
Oil prices fell on Wednesday, extending overnight losses after industry data showed U.S. crude stockpiles grew more than expected in the past week. Investors were also wary of upcoming U.S. CPI inflation data, which could point to more rate hike risks from the Federal Reserve.
Brent Oil Futures fell 0.4% to $96.09 a barrel, while U.S. Crude Oil WTI Futures shed 0.3% and traded at $90.22.
Data from the American Petroleum Institute showed that U.S. oil inventories grew more than expected in the prior week. Stocks of crude oil, gasoline, and distillates stood at 2.16 million barrels, compared with a forecast of less than 100,000 barrels. The reading likely indicates a parallel figure from official data due later in the day- which would mark a second straight week of unexpectedly large U.S. oil inventories.
WTI is also trading lower and moving downward due to the lower demand and high sell-off below $89.50 per barrel. However, WTI is trading at the support of 87.50 but indicates a high probability of breaking below towards $85 a barrel unless the sell-off pressure was met with buying force.
| SUPPORT | RESISTANCE |
| 86.40 | 89.50 |
| 85.00 | 90.65 |
| 77.00 | 91.70 |
Key Takeaways: Progress in trade talks between the U.S. And India Oil falls to lowest…
Gold shows Strong uptrend with price respecting a rising trendline on the hourly chart. All…
The recent shift in momentum began after EUR/USD failed to clear the 1.1420 resistance. This…
Gold prices extended their retreat midweek as investors continued to pare back safe-haven positions amid…
Key Takeaways: OPEC+ to increase oil production in JuneU.S. Stock futures open lower as US-China…
West Texas Intermediate shows a clear downtrend on the hourly chart as seen through the…
This website uses cookies.